Excel random number generator – With Analysis function
Do you want to use Excel to create the next numbers for your lottery ticket, or would you like Excel to randomly draw the winner and the prize itself from a table? There are various options for how you can use a random number generator in Excel or draw random numbers. So today we want to look at different ways how it can work.
In doing so, we will once again reveal a hidden function in Excel that is not visible by default.
Random numbers in Excel with a formula
Random numbers in Excel with a formula
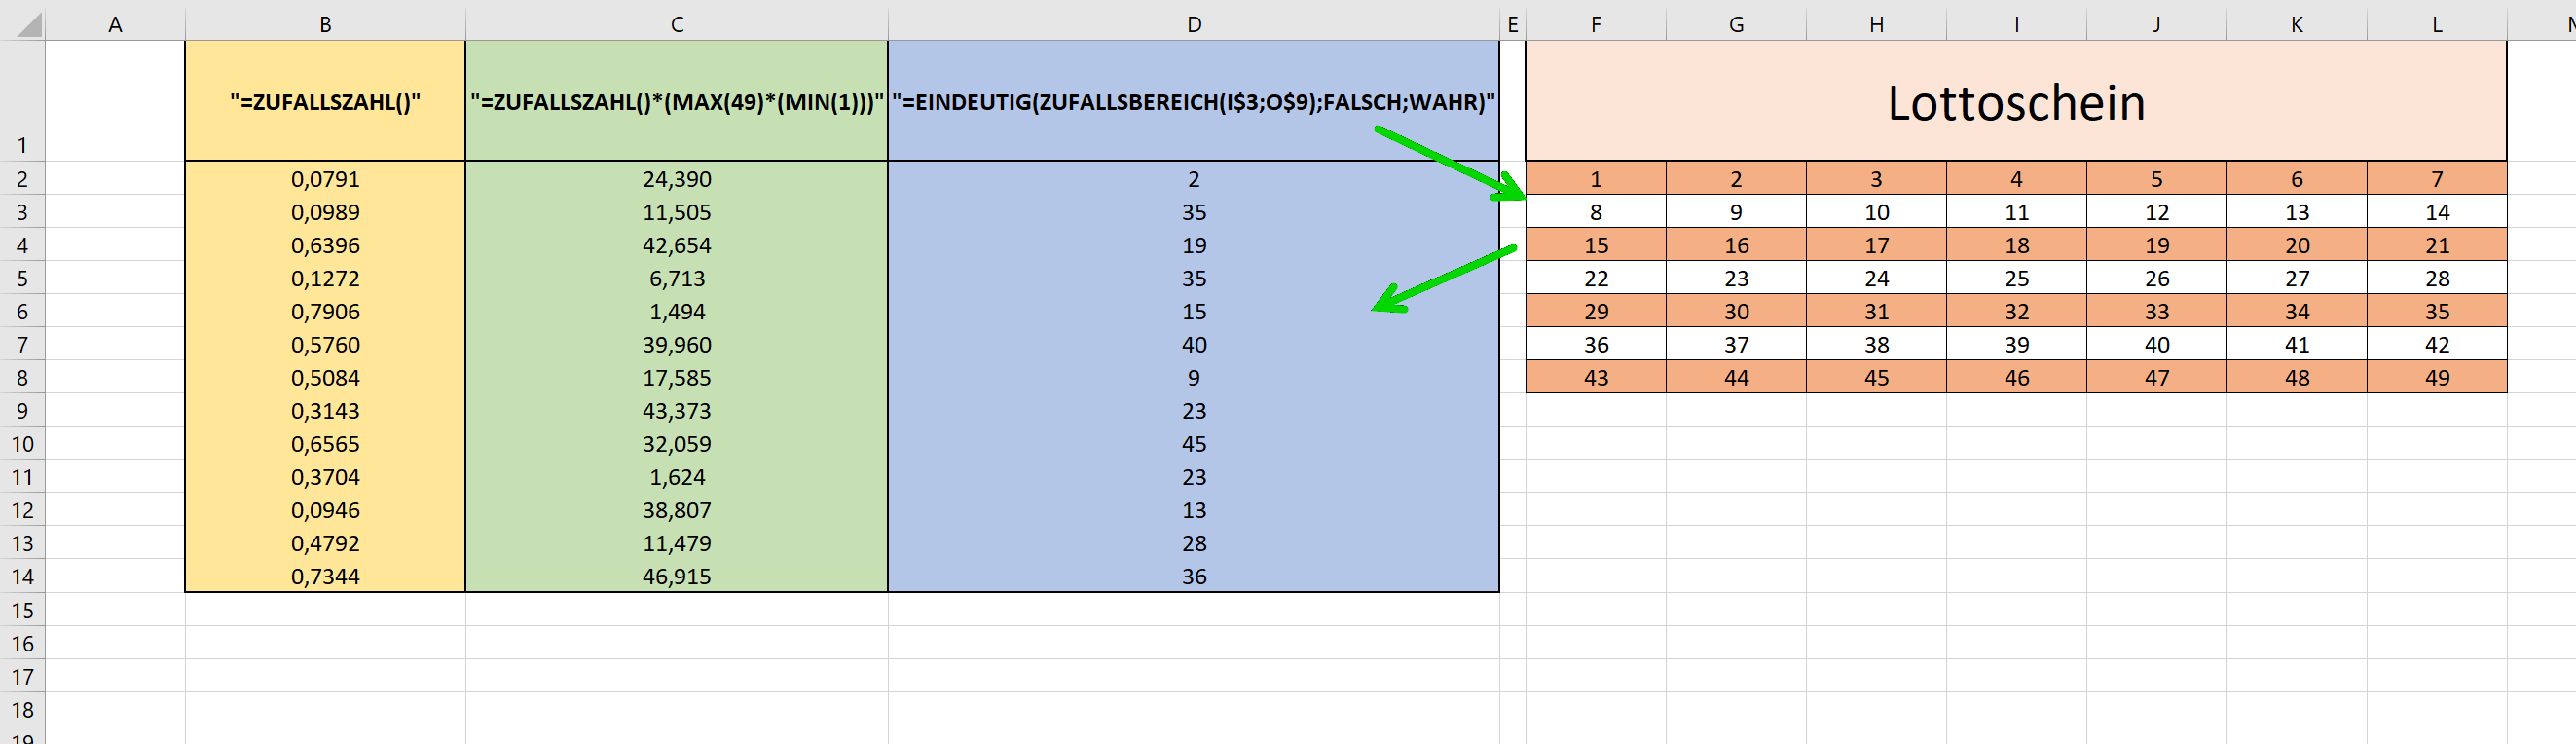
In Excel, you can generate random numbers with the formula “=RAND()“.
This formula would return a random number between 0 and 1. You can then use this random number to generate other numbers. For example, you can use the formula “=RAND() * 100” to generate a random number between 0 and 100. You can specify the number of decimal places and the formatting (e.g. currency in €) yourself in the “Start” tab.
If you want to generate a random number that falls within a certain range, you can use the formula “=RAND()*(MAX(49)*(MIN(1)))“. Here “max” would be the maximum value 49 and “min” the minimum value 1 between which the random number should lie.
If you want to generate a random number that is new every time you update or recalculate your spreadsheet, you can paste the formula into a cell and then press the F9 key to recalculate the formula and get a new random number to generate. You could also create a table that, like in our example, shows the number series of a 6 out of 49 lottery ticket, and from this with the function: “=UNIQUE(RANDOM(I$3;O$9);FALSE;TRUE)” random and unique draw numbers. For a deeper understanding of the “$” characters used, I recommend our article on absolute, relative, and mixed cell references.
Note: Since the random numbers are based on Excel formulas, they are regenerated each time the spreadsheet is updated. However, if you want a random number to be generated only once and then remain constant, you can copy and paste the random number as a value. The nested functions that we have applied here can be changed and adjusted at will. For example, you could also extend the function with “=INTEGRATE(…” if you only want whole numbers, and so on and so forth. It also helps to simply try it out to explore the limits of functionality. Find more about nested functions here with us >>>
see fig. (click to enlarge)
Random numbers in Excel using the analyze function
Random numbers in Excel using the analyze function
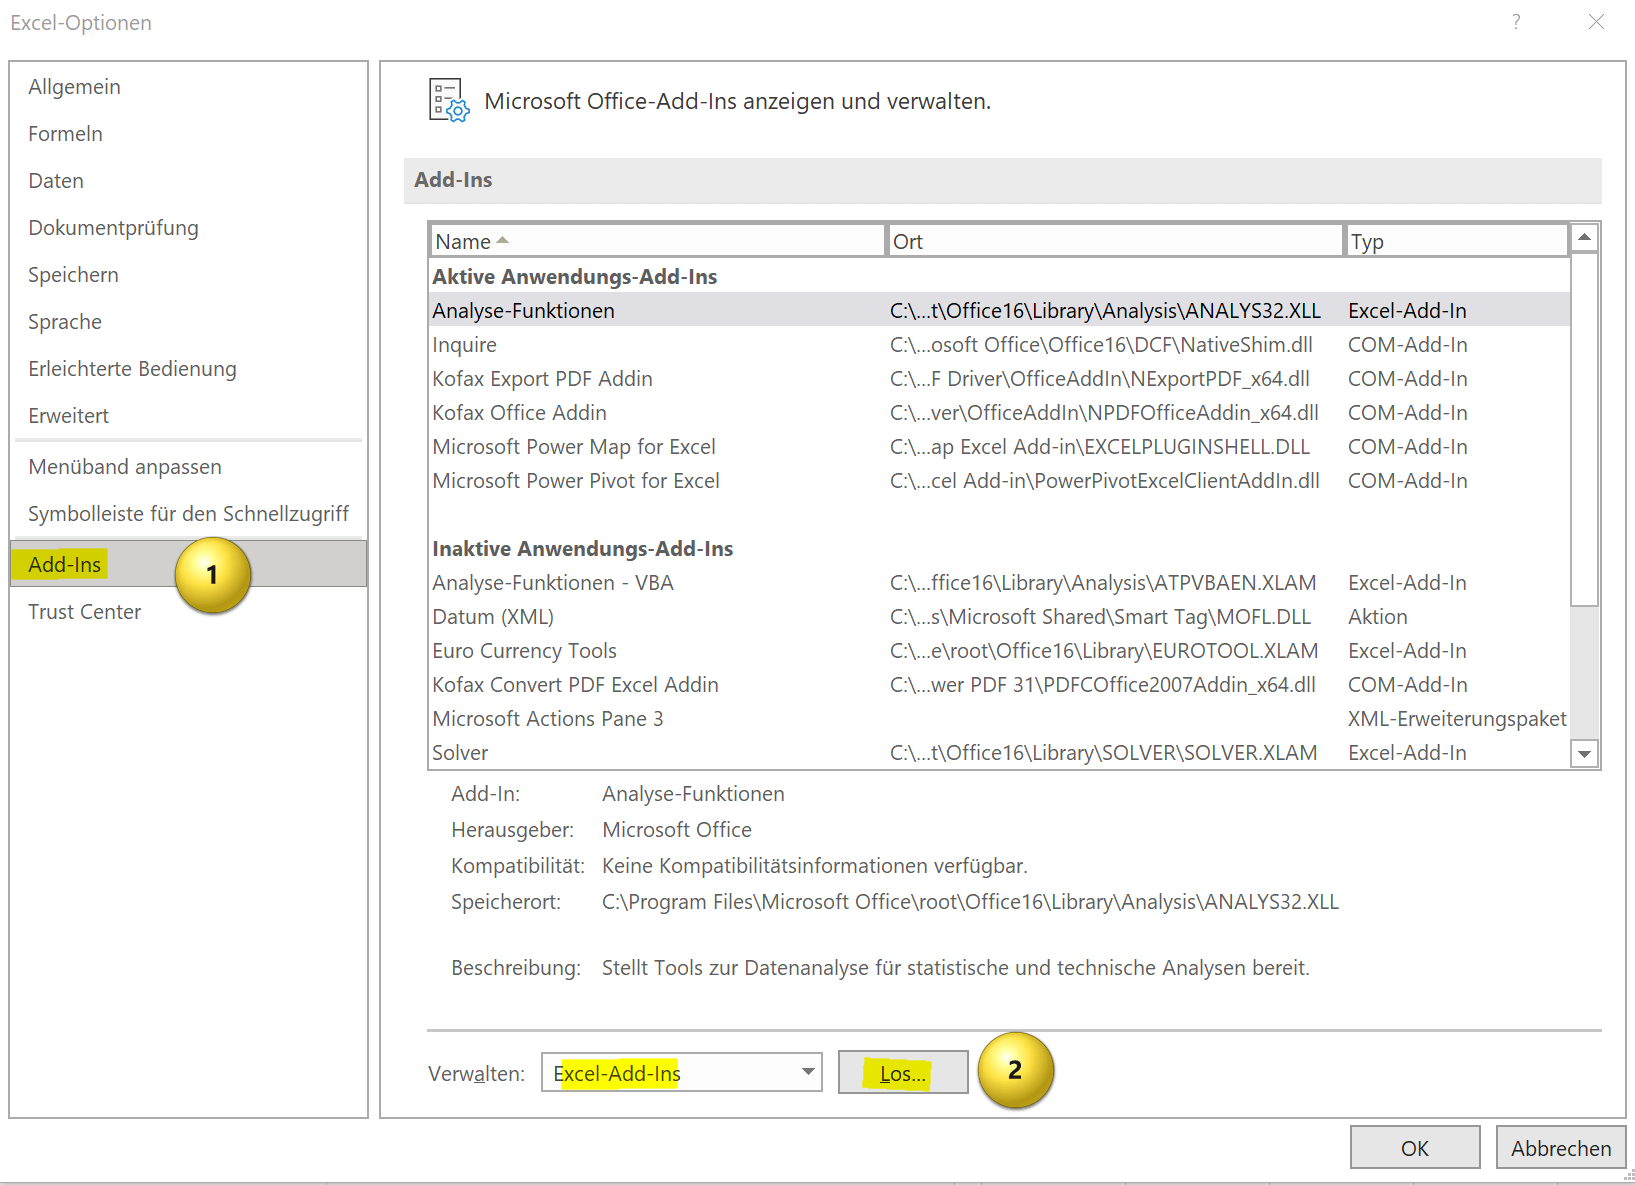
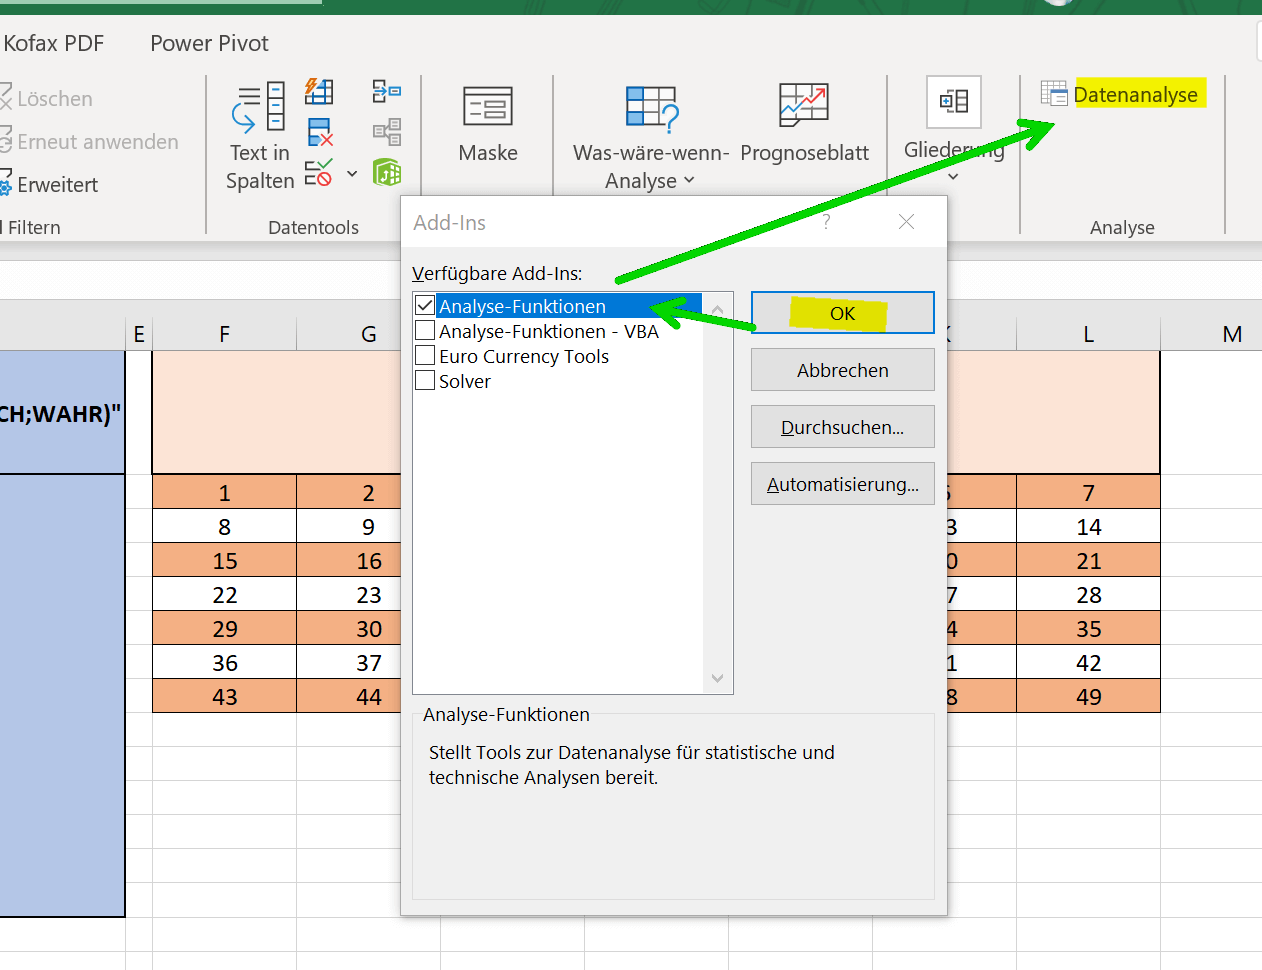
Since we already used the term “analysis function” in the title, we now want to go into more detail about it. By default, this data analysis feature is not enabled in Excel. To enable data analysis option in Excel, you need to follow the following steps:
- Open Excel and click on the “File” tab.
- Click “Options“.
- In the left pane of the Excel Options window, select Add-Ins.
- From the Manage drop-down menu, select Excel Add-ins and click Go.
- Check the box next to “Data Analysis” and click OK.
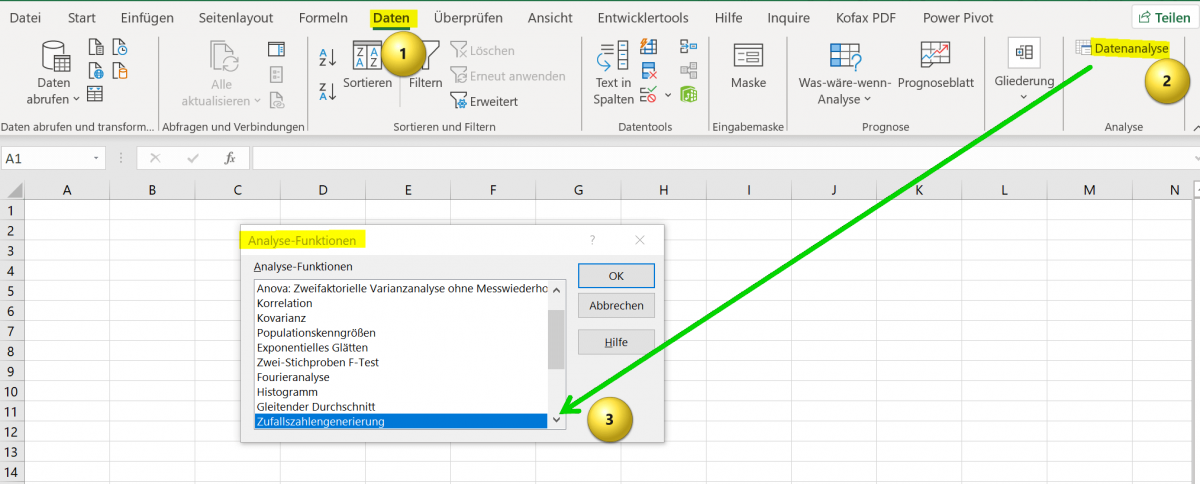
- The data analysis feature should now be available in the “Data” tab in your ribbon and you can use the various data analysis tools.
If you don’t see the Data Analysis option in the list of available add-ins, you may need to install the add-in. To do this, simply click “Browse” to locate and install the add-in installation file.
see fig. (click to enlarge)
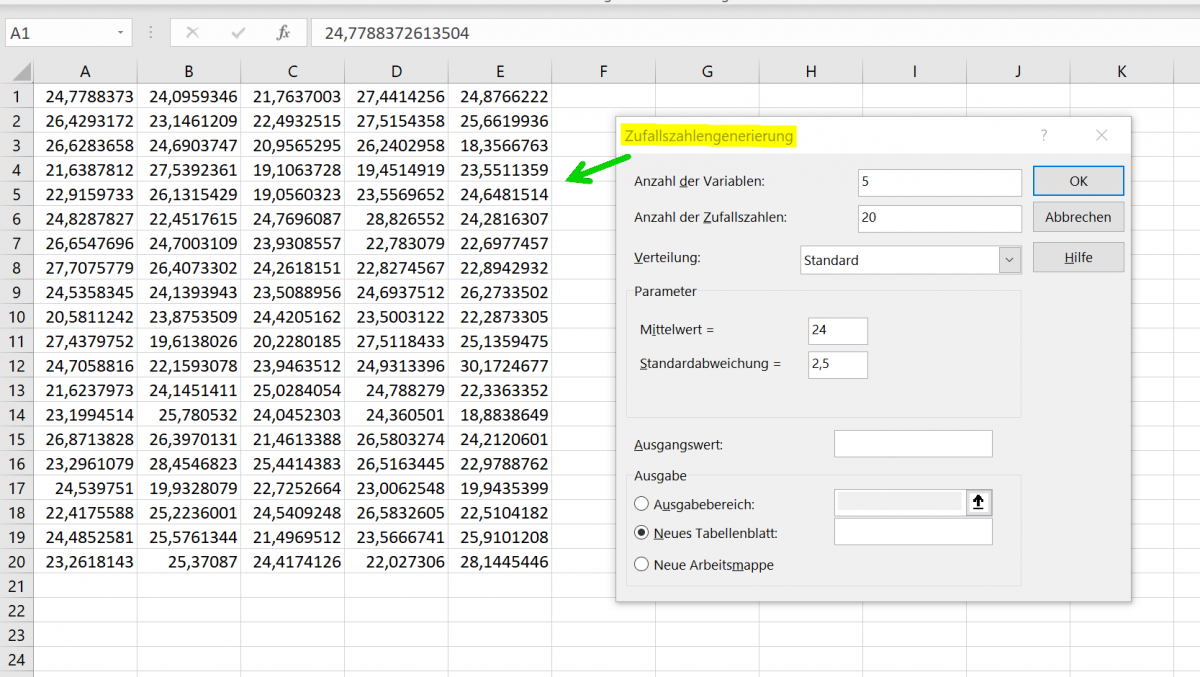
With the analysis function, you have expanded your options in Excel a good deal again, and we can also use the analysis function to determine random numbers. For our example, let’s take a new spreadsheet and click on “Data Analysis” on the “Data” tab. We have set the number of variables to 5, and we want 20 different random numbers to be generated for each variable with a “standard deviation” or normal distribution of 2.5.
We let Excel start the random number generation in cell A1. After clicking on “Ok” we are presented with our numbers with an even distribution. This also becomes clear when we display a diagram of the numerical values in column A, as shown in the example.
see fig. (click to enlarge)
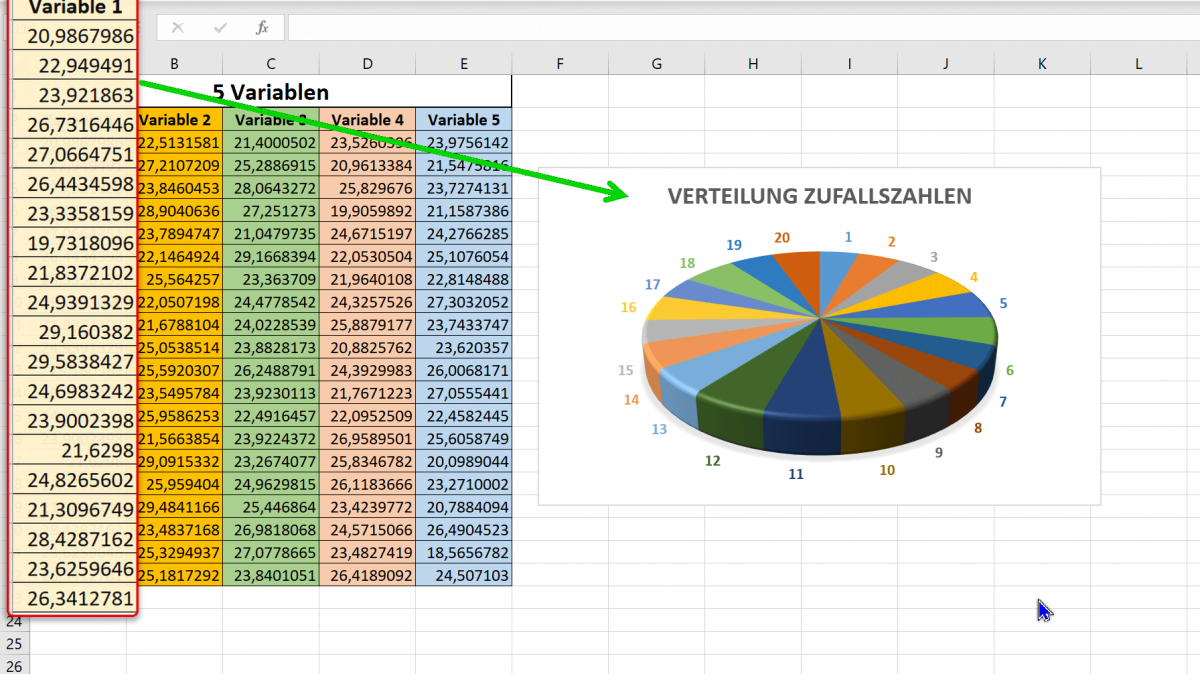
We hope that we could help you with our little tutorial regarding random numbers in Excel, also by using the data analysis option. Feel free to experiment with this feature to discover more possibilities.
Since we already used the term “analysis function” in the title, we now want to go into more detail about it. By default, this data analysis feature is not enabled in Excel. To enable data analysis option in Excel, you need to follow the following steps:
- Open Excel and click on the “File” tab.
- Click “Options“.
- In the left pane of the Excel Options window, select Add-Ins.
- From the Manage drop-down menu, select Excel Add-ins and click Go.
- Check the box next to “Data Analysis” and click OK.
- The data analysis feature should now be available in the “Data” tab in your ribbon and you can use the various data analysis tools.
If you don’t see the Data Analysis option in the list of available add-ins, you may need to install the add-in. To do this, simply click “Browse” to locate and install the add-in installation file.
see fig. (click to enlarge)
With the analysis function, you have expanded your options in Excel a good deal again, and we can also use the analysis function to determine random numbers. For our example, let’s take a new spreadsheet and click on “Data Analysis” on the “Data” tab. We have set the number of variables to 5, and we want 20 different random numbers to be generated for each variable with a “standard deviation” or normal distribution of 2.5.
We let Excel start the random number generation in cell A1. After clicking on “Ok” we are presented with our numbers with an even distribution. This also becomes clear when we display a diagram of the numerical values in column A, as shown in the example.
see fig. (click to enlarge)
We hope that we could help you with our little tutorial regarding random numbers in Excel, also by using the data analysis option. Feel free to experiment with this feature to discover more possibilities.
Popular Posts:

Ad-free home network: Install Pi-hole on Windows
Say goodbye to ads on smart TVs and in apps: Pi-hole software turns your Windows laptop into a network filter. This article explains step-by-step how to install it via Docker and configure the necessary DNS settings in your FRITZ!Box.

How to tune your FRITZ!Box into a professional call server
A professional telephone system can be built using a FRITZ!Box and a laptop. This article shows step by step how to use the free software "Phoner" to schedule announcements and record calls – including important legal information (§ 201 StGB).

Why to-do lists are a waste of time
Do you feel unproductive at the end of the day, even though you've worked hard? Your to-do list is to blame. It tempts you to focus on easy tasks and ignores your limited time. This article explains why lists are "self-deception" and why professionals use a calendar instead.

Smartphone Wi-Fi security: Public hotspots vs. home network
Is smartphone Wi-Fi a security risk? This article analyzes in detail threats such as evil twin attacks and explains protective measures for when you're on the go. We also clarify why home Wi-Fi is usually secure and how you can effectively separate your smart home from sensitive data using a guest network.

Warum dein Excel-Kurs Zeitverschwendung ist – was du wirklich lernen solltest!
Hand aufs Herz: Wann hast du zuletzt eine komplexe Excel-Formel ohne Googeln getippt? Eben. KI schreibt heute den Code für dich. Erfahre, warum klassische Excel-Trainings veraltet sind und welche 3 modernen Skills deinen Marktwert im Büro jetzt massiv steigern.

Cybersicherheit: Die 3 größten Fehler, die 90% aller Mitarbeiter machen
Hacker brauchen keine Codes, sie brauchen nur einen unaufmerksamen Mitarbeiter. Von Passwort-Recycling bis zum gefährlichen Klick: Wir zeigen die drei häufigsten Fehler im Büroalltag und geben praktische Tipps, wie Sie zur menschlichen Firewall werden.
Offers 2024: Word & Excel Templates


Popular Posts:
Ad-free home network: Install Pi-hole on Windows
Say goodbye to ads on smart TVs and in apps: Pi-hole software turns your Windows laptop into a network filter. This article explains step-by-step how to install it via Docker and configure the necessary DNS settings in your FRITZ!Box.
How to tune your FRITZ!Box into a professional call server
A professional telephone system can be built using a FRITZ!Box and a laptop. This article shows step by step how to use the free software "Phoner" to schedule announcements and record calls – including important legal information (§ 201 StGB).
Why to-do lists are a waste of time
Do you feel unproductive at the end of the day, even though you've worked hard? Your to-do list is to blame. It tempts you to focus on easy tasks and ignores your limited time. This article explains why lists are "self-deception" and why professionals use a calendar instead.
Smartphone Wi-Fi security: Public hotspots vs. home network
Is smartphone Wi-Fi a security risk? This article analyzes in detail threats such as evil twin attacks and explains protective measures for when you're on the go. We also clarify why home Wi-Fi is usually secure and how you can effectively separate your smart home from sensitive data using a guest network.
Warum dein Excel-Kurs Zeitverschwendung ist – was du wirklich lernen solltest!
Hand aufs Herz: Wann hast du zuletzt eine komplexe Excel-Formel ohne Googeln getippt? Eben. KI schreibt heute den Code für dich. Erfahre, warum klassische Excel-Trainings veraltet sind und welche 3 modernen Skills deinen Marktwert im Büro jetzt massiv steigern.
Cybersicherheit: Die 3 größten Fehler, die 90% aller Mitarbeiter machen
Hacker brauchen keine Codes, sie brauchen nur einen unaufmerksamen Mitarbeiter. Von Passwort-Recycling bis zum gefährlichen Klick: Wir zeigen die drei häufigsten Fehler im Büroalltag und geben praktische Tipps, wie Sie zur menschlichen Firewall werden.
Offers 2024: Word & Excel Templates