
Create Excel Budget Book – with Statistics – Tutorial
Create your own Excel budget book with a graphical dashboard, statistics, trends and data cut-off. A lot is possible with pivot tables and pivot charts.

Create your own Excel budget book with a graphical dashboard, statistics, trends and data cut-off. A lot is possible with pivot tables and pivot charts.
Inserting a header and footer in Excel is far from user-friendly. We show ways and workarounds how you can do it anyway.
Pretty much everyone who uses Excel knows the Vreference and the Wreference. On the other hand, something newer is the X reference, which can be used to iron out some of the weaknesses of the functions used up to now. We explain the differences between Xreference and Sreference & Wreference.
Almost everyone has heard of the term "macro" in the context of Excel, and perhaps has shied away from it because it sounds like a rather complicated affair for which you have to deal with Excel programming.
Nested functions in Excel offer the possibility to combine several arguments with each other or to exclude conditions. We explain how it works.
We explain how you can create your own vacation planner 2022 in Microsoft Excel. And of course with a display of public holidays and weekends.
In our tutorial we describe how you can create an annual calendar for 2022 with a display of the calendar week and public holidays in Excel, and use it anew every year.
E: info@ms-office-training.de
P: (+49) 04181-360254
Mon. – Fr. – 09h to 16:30h
© Copyright 2015 – 2024 | MS-OFFICE-TRAINING
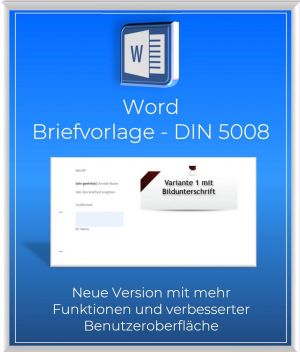 Word letter template DIN 5008 - with form fields
4,95 € – 5,95 €
Word letter template DIN 5008 - with form fields
4,95 € – 5,95 €
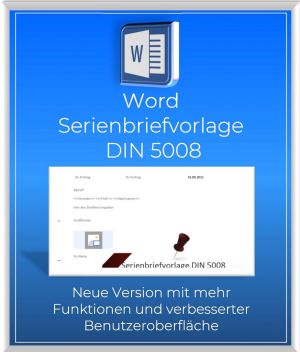 Word Serienbriefvorlage nach DIN 5008 | (Business & Standard)
Original price was: 12,95 €.8,95 €Current price is: 8,95 €.
Word Serienbriefvorlage nach DIN 5008 | (Business & Standard)
Original price was: 12,95 €.8,95 €Current price is: 8,95 €.
 Excel vacation planner 2023 | with holidays |
Original price was: 14,95 €.9,95 €Current price is: 9,95 €.
Excel vacation planner 2023 | with holidays |
Original price was: 14,95 €.9,95 €Current price is: 9,95 €.
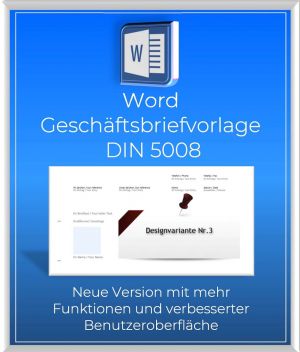 Word business letter template 2023 - DIN 5008
Original price was: 14,95 €.10,95 €Current price is: 10,95 €.
Word business letter template 2023 - DIN 5008
Original price was: 14,95 €.10,95 €Current price is: 10,95 €.
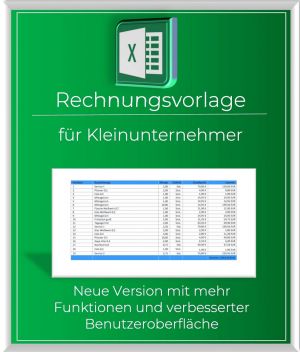 Excel Invoice template (not VAT) incl. Master Data
Original price was: 24,95 €.14,95 €Current price is: 14,95 €.
Excel Invoice template (not VAT) incl. Master Data
Original price was: 24,95 €.14,95 €Current price is: 14,95 €.
 Excel budget book with dashboard and stock market indices
Original price was: 39,95 €.19,95 €Current price is: 19,95 €.
Excel budget book with dashboard and stock market indices
Original price was: 39,95 €.19,95 €Current price is: 19,95 €.
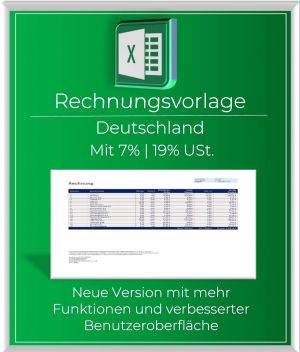 Excel Invoice Template 2023 | GER | VAT with 7% | 19%
Original price was: 29,95 €.19,95 €Current price is: 19,95 €.
Excel Invoice Template 2023 | GER | VAT with 7% | 19%
Original price was: 29,95 €.19,95 €Current price is: 19,95 €.
 Excel invoice template 2023 - for Austria - 10% | 13% | 20%
Original price was: 29,95 €.19,95 €Current price is: 19,95 €.
Excel invoice template 2023 - for Austria - 10% | 13% | 20%
Original price was: 29,95 €.19,95 €Current price is: 19,95 €.


